Statistical process control (SPC) refers to a quality control approach that utilizes statistical techniques for the supervision and regulation of a process to guarantee its adherence to predefined specifications. SPC is utilized for the purpose of managing and enhancing production processes, with the goal of boosting both the efficiency of processes and the quality of the resulting products.
In this article, we will delve into the different elements for food processors to bear in mind for successfully establishing a statistical process control in their manufacturing unit as part of their food quality management efforts.
Six Sigma is a quality enhancement initiative with the prime purpose of minimizing defects to a level of 3.4 parts per million (PPM) through the reduction of process variations. SPC is a subset tool of Six Sigma used to keep a close eye on production operations to spot any abnormalities and alert the company so they can fix it before it gets worse. This is achieved through a structured methodology known as DMAIC:
Define: In this phase, the project goals, scope, and customer requirements are clearly defined. This helps ensure that the improvement efforts are aligned with the needs of both internal and external stakeholders.
Measure: During this phase, relevant data is collected, and measurements are taken to assess the current performance of the process. This step helps quantify the extent of variability and identify key areas of concern.
Analyze: The data collected in the previous phase is analyzed to identify the root causes of defects or inefficiencies. Statistical tools and techniques are employed to pinpoint the factors contributing to process variations.
Improve: In this phase, solutions are developed and implemented to address the identified root causes. These solutions are tested and refined to ensure they have a positive impact on process performance.
Control: The improvements made in the previous phase are integrated into the process, and measures are put in place to monitor and sustain the enhanced performance over time. Control mechanisms are established to prevent the re-emergence of defects and variations.
Key Components for Understanding SPC
Process Variation
The basic assumption of SPC is that all processes are generally subject to variation. Variation is the inherent tendency of a process to deviate, move, shift, or vary around a mean central point. It is a phenomenon that can be observed throughout nature as all processes have variations and are impossible to eliminate. By understanding and knowing the degree and nature of variability, it is possible to control the variation.
Data Monitoring
Controlling process variations necessitates monitoring and measuring the collected data, and in food companies, the principle of Hazard Analysis Critical Control Point (HACCP) accomplishes this goal. Monitoring data in food quality management is based on two requirements;
Compliance with regulations and customer demands
Risk in the process or product
Analyzing Data
Measuring an ample amount of data can be followed by simply determining if the data point meets the specification or analyzing the data using SPC techniques to describe the process in terms of capability to meet the specification consistently. Even if process data yields compliance with the mandated specifications, slight shifts in the process could eventually lead to out-of-spec results over time. With the application of SPC, these variations can be revealed and rectified in time, thereby proactively preventing their occurrence in the long run.
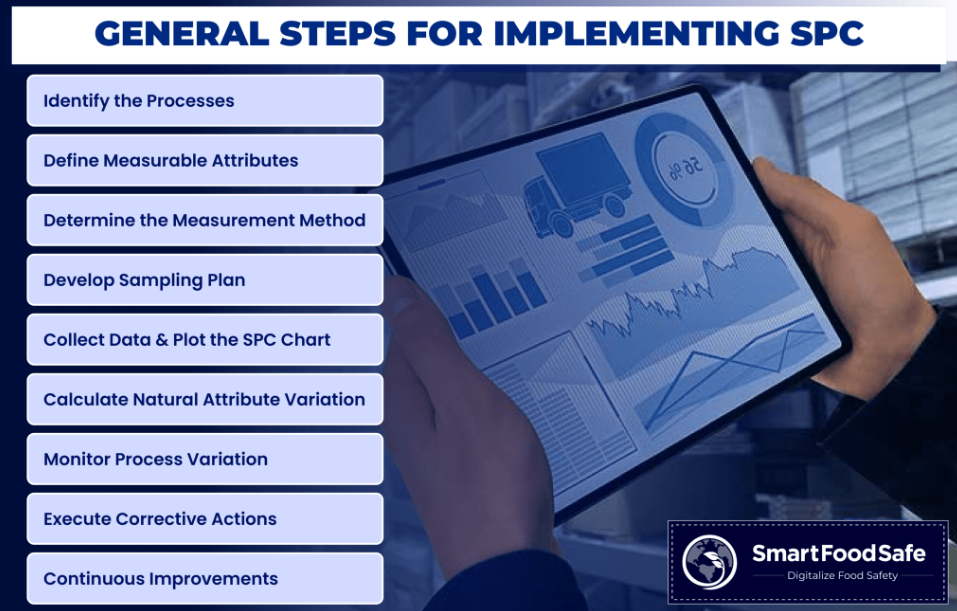
General Steps for Implementing SPC in the Process
Identify the Processes: To begin, specify the crucial processes that significantly influence the product’s output or the process that holds paramount importance to the customer.
Define Measurable Process Attributes: Recognize the specific attributes that have to be measured throughout the production phase.
Determine the Measurement Method: Formulate instructions or a procedure for the measurement method, including the instruments employed for measurement.
Develop Subgroup Strategy and Sampling Plan: Moving forward, strategize the size of subgroups and frequency of the samples to be collected based on the product’s critical nature.
Collect Data and Plot the SPC Chart: Proceed to collect data according to the defined sample size. Choose an appropriate SPC chart considering the type of data (Continuous or Discrete) and the size of subgroups.
Describe the Natural Variation of Attributes: Calculate the control limits. Derive the upper control limit (UCL) and the lower control limit (LCL) for both X-Bar and Range. For the X-Bar chart, the UCL and LCL help indicate if the process mean is consistent and within acceptable bounds. On the other hand, for the Range chart, the UCL and LCL help gauge the variability or spread of data within subgroups.
Monitor Process Variation: Interpret the control chart, scrutinizing any out-of-control points and discerning patterns. Given that this is a continuous endeavor, consistently oversee process variability.
Execute Corrective Actions: If any out-of-control points or patterns are identified, implement appropriate corrective actions to bring the process back under control and prevent further deviations.
Ensure Continuous Enhancement: Continuously analyze the gathered data and insights from the control chart to identify opportunities for process improvement and refinement, aiming for ongoing enhancement of the production process.
With the tech-enabled features of Smart Food Safe’s multitude of digital modules, food establishments can implement statistical process control (SPC) for a robust quality control system that facilitates the detection of variations and deviations in food production processes, ensuring consistent product quality while limiting waste and risks.
Our custom reporting feature empowers businesses in the food industry by serving as a valuable tool for enabling the creation of specialized process control charts and identifying and addressing compliance gaps within the food production processes. Intuitive dashboards provide a consolidated place for presenting these charts, offering a visual representation of key performance indicators and critical control points, aiding businesses in closely monitoring their operations. In this way, businesses can proactively pinpoint areas for refinement, optimize their processes, and ultimately bolster the overall safety and quality of their food products.
_1.png)